Make a scatterplot matrix of diagnostics results from a
complr object, with density and rug plots on the diagonal.
Arguments
- x
A
diagnosticsclass object created bydiagnostics.complr.- transform
Character string indicating whether to plot the raw composition values in
x$xor centered logratio transformed values. Defaults to"clr".- ...
Currently unused.
Value
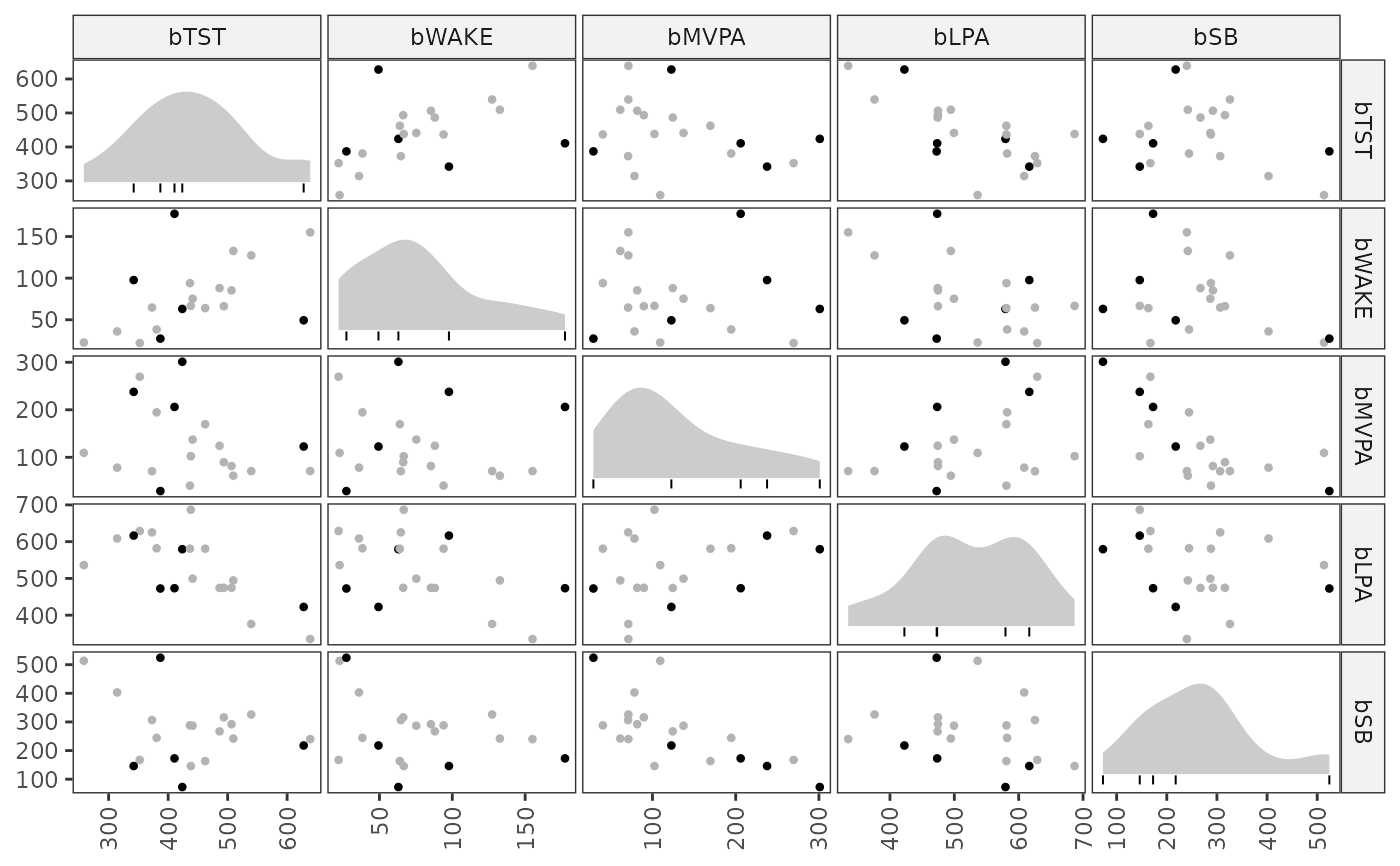
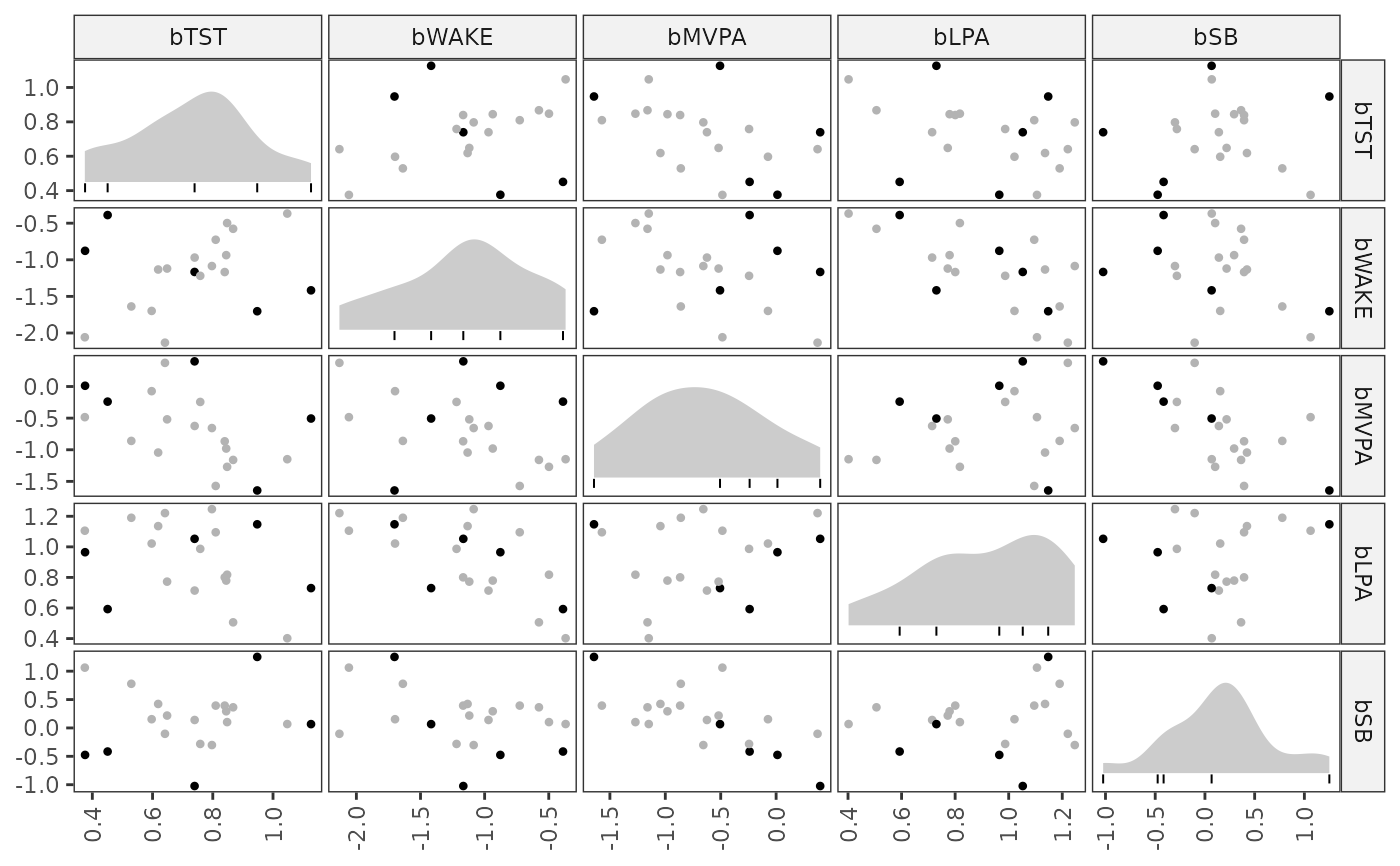
A ggplot graph object showing pairwise scatterplots for each composition part, with point colour indicating extreme value status. Diagonal panels show marginal densities and rug marks for observations flagged as extreme values.
Examples
data(mcompd)
data(sbp)

ids <- unique(mcompd$ID)[1:20]
cilr <- complr(
  data = mcompd[ID %in% ids, .SD[1:3], by = ID],
  sbp = sbp,
  parts = c("TST", "WAKE", "MVPA", "LPA", "SB"),
  idvar = "ID",
  total = 1440
)

between_diag <- diagnostics(cilr, level = "between", ev.perc = .05)

# Plot centered logratio transformed composition values
plot(between_diag)


# Plot on the raw composition scale
plot(between_diag, transform = "raw")
# Plot on the raw composition scale
plot(between_diag, transform = "raw")